Client Reporting
Let our Client Services team show you how much data you could manage.
Tour Symbol Stats today:
Types of Reporting Available to Symbol Clients
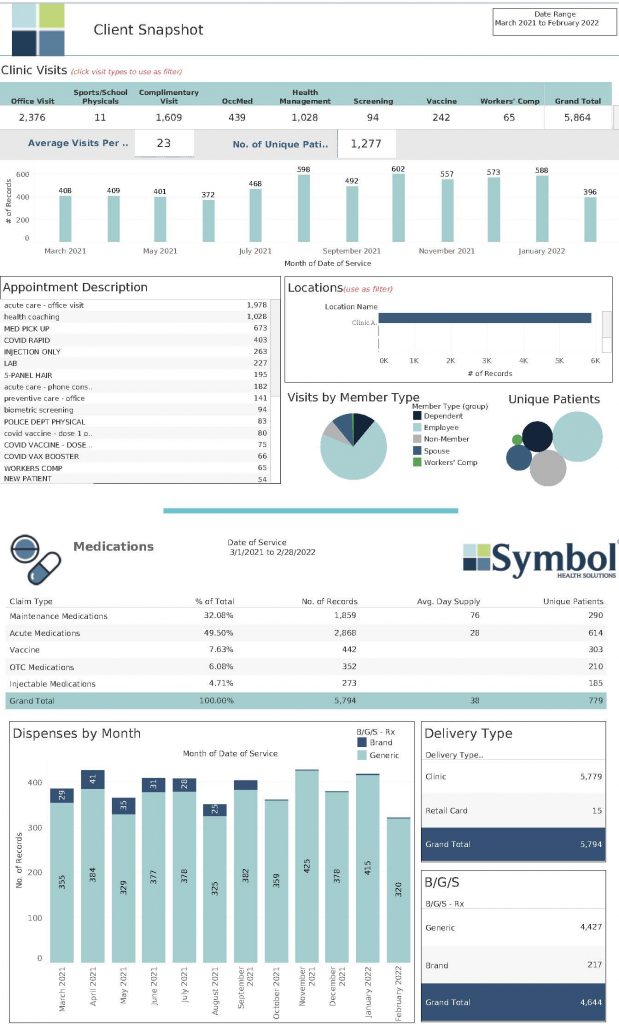
Clinic Activity
Clinic activity such as encounters by appointment types, member types (employee, spouse, or dependent), location, provider, and appointment status. Symbol has systems in place to track diagnosis, procedures, labs, and medications by frequency and costs. Furthermore, all data is HIPAA-compliant.
Savings Report
Symbol provides year-over-year performance for both the health plan and clinic. This amount is reported in total dollars and per employee per month (PEPM). We report any impacts the clinic has had to the clients health plan such as reduction in trending cost and diversion savings. Diversion savings is calculated by multiple the number of clinic visits by the market rate and subtracting the costs of the clinic visit. In addition to diverting visits, Symbol considers productivity savings when employees are spending less time outside of work.
Health Outcomes
Symbol will filter analytical data points on a “focus population” that we monitor
throughout their journey with Symbol using both our in-house and third-party data
analytics software platforms. Each year, Symbol creates a Cohort Report to show the
improvements in the focus population and learn if any changes need to be made
to the clinic/program. All data is HIPAA-compliant to protect patient privacy.
Predictive Modeling
Symbol utilizes third-party data science partner, Springbuk, which has developed a new algorithm to help predict employer healthcare costs. This proprietary algorithm takes claims information gathered through the Springbuk data pipeline, analyzes net payments, and makes forecasts for future periods from that historical information. Springbuk forecasting is utilized as a guidance only, it’s not as verifiable as Value on Investment (VOI). Symbol’s data analysis is predominantly centered around hard and fast electronic health records, claims data, and Symbol Health Coaching data.
Medication
Medications are reported by acute vs. maintenance, brand vs. generic, prescription vs. over-the-counter, and by treatment type. All data is HIPAA-compliant, providing only aggregate reporting of medication dispensed - not individual patient data.
Cost Report
Monthly, digital, and interactive dashboards are available from Symbol for clinic utilization. Austal will have access to previous and current clinic activity at their fingertips. Symbol will provide two (2) viewer access licenses. Symbol develops an Annual Value Report each calendar year to illustrate empirical metrics and a more detailed analysis on the many impacts the clinic has on the wellbeing of the client’s employees and their bottom line.
Productivity/ Absenteeism
Reduced number of PTO/sick hours. We calculate productivity by multiplying the
amount of time saved by going to the clinic versus the traditional doctor’s office by
the employee’s compensation. Most traditional office visits can take up to 3 hours
with commute and wait times but Symbol strives to have an office visit in less than 30
minutes while still maintaining a professional, thorough exam. Productivity reports remain HIPAA-compliant to protect the privacy of clinic participants and patients.
Satisfaction
Symbol uses NPS, or Net Promoter Score, which measures customer/patient experience and provides the best metric to anchor our customer experience management program. We utilize NPS for each clinic, as well as randomly selected questions about patient experiences. Our Marketing and Client Services Departments will also tailor survey campaigns that promote and reward our staff and patients to utilize the survey. Reports are provided to clients upon request.
Preview a Sample Symbol Stats Dashboard:
On-Demand Insights
Don’t wait for an annual report.
Log in to a secure client portal any time you need the latest monthly clinic data.